Filters
Question type

Study Flashcards

In a multiple regression model, the partial regression coefficient of an independent variable represents the increase in the y variable when that independent variable is increased by one unit if the values of all other independent variables are held constant.

A) True
B) False

Correct Answer

verifed

verified

A market analyst is developing a regression model to predict monthly household expenditures on groceries as a function of family size, household income, and household neighborhood (urban, suburban, and rural) .The "neighborhood" variable in this model is ______.


A) an independent variable
B) a response variable
C) a quantitative variable
D) a dependent variable
E) a constant

F) All of the above
G) B) and D)

Correct Answer

verifed

verified

The following ANOVA table is from a multiple regression analysis.  Source dfSSMSFp Repression 31500 Error 26 Total 2300\begin{array} { | c | c | c | c | c | c | } \hline \text { Source } & \mathrm { df } & \mathrm { SS } & \mathrm { MS } & F & p \\\hline \text { Repression } & 3 & 1500 & & & \\\hline \text { Error } & 26 & & & & \\\hline \text { Total } & & 2300 & & & \\\hline\end{array} The R2 value is __________.


A) 0.65
B) 0.53
C) 0.35
D) 0.43
E) 1.37

F) None of the above
G) B) and E)

Correct Answer

verifed

verified

A multiple regression analysis produced the following tables.  Predictor  Coefficients  Stardard Error t Statistic p-value  Irtercept 512.235978.497127.9561766.88E06x17.15251.6522555.1863190.000301x22.02080.6991946.7742483.06E05\begin{array} { | c | c | c | c | c | } \hline \text { Predictor } & \text { Coefficients } & \text { Stardard Error } & t \text { Statistic } & p \text {-value } \\\hline \text { Irtercept } & 512.2359 & 78.49712 & 7.956176 & 6.88 \mathrm { E } - 06 \\\hline \boldsymbol { x } _ { 1 } & 7.1525 & 1.652255 & 5.186319 & \mathbf { 0 . 0 0 0 3 0 1 } \\\hline \mathbf { x } _ { 2 } & \mathbf { 2 . 0 2 0 8 } & 0.699194 & 6.774248 & \mathbf { 3 . 0 6 E - 0 5 } \\\hline\end{array}  Source df SS  MS Fp-value  Repression 21660914830457.158.319561.4E06 Residual 11156637.514239.77 Total 131817552\begin{array} { | c | c | c | c | c | c | } \hline \text { Source } & \mathrm { df } & \text { SS } & \text { MS } & F & p \text {-value } \\\hline \text { Repression } & 2 & 1660914 & \mathbf { 8 3 0 4 5 7 . 1 } & 58.31956 & 1.4 \mathrm { E } - 06 \\\hline \text { Residual } & 11 & 156637.5 & 14239.77 & & \\\hline \text { Total } & 13 & 1817552 & & & \\\hline\end{array} If x1= 25 and x2 = 85, then the predicted value of y is ____________.


A) 803.891
B) 807.255
C) 812.025
D) 825.517
E) 862.816

F) All of the above
G) A) and B)

Correct Answer

verifed

verified

Regression analysis with two dependent variables and two or more independent variables is called multiple regression.

A) True
B) False

Correct Answer

verifed

verified

The following ANOVA table is from a multiple regression analysis.  Source dfSSMSFp Repression 31500 Error 26 Total 2300\begin{array} { | c | c | c | c | c | c | } \hline \text { Source } & \mathrm { df } & \mathrm { SS } & \mathrm { MS } & F & p \\\hline \text { Repression } & 3 & 1500 & & & \\\hline \text { Error } & 26 & & & & \\\hline \text { Total } & & 2300 & & & \\\hline\end{array} The MSE value is closest to__________.


A) 31
B) 500
C) 16
D) 2300
E) 8.7

F) A) and D)
G) B) and C)

Correct Answer

verifed

verified

In the model y = β\beta 0 + β\beta 1x1 + β\beta 2x2 + β\beta 3x3 + ε\varepsilon , ε\varepsilon is a constant.

A) True
B) False

Correct Answer

verifed

verified

A multiple regression analysis produced the following tables.  Predictor  Coefficients  Stardard Eror t Statistic p-value  Irtercept 616.6849154.55343.9901080.000947x13.338332.3335481.430580.170675x21.7800750.3356055.304075.83E05\begin{array} { | c | c | c | c | c | } \hline \text { Predictor } & \text { Coefficients } & \text { Stardard Eror } & \boldsymbol { t } \text { Statistic } & p \text {-value } \\\hline \text { Irtercept } & 616.6849 & 154.5534 & 3.990108 & 0.000947 \\\hline \boldsymbol { x } _ { 1 } & - 3.33833 & \mathbf { 2 . 3 3 3 5 4 8 } & - 1.43058 & \mathbf { 0 . 1 7 0 6 7 5 } \\\hline \mathbf { x } _ { 2 } & 1.780075 & \mathbf { 0 . 3 3 5 6 0 5 } & 5.30407 & 5.83 \mathrm { E } - 05 \\\hline\end{array}  Source df SS  MS Fp-value  Repression 212178360891.4814.761170.000286 Residual 1561876.684125.112 Total 17183659.6\begin{array} { | c | c | c | c | c | c | } \hline \text { Source } & \mathrm { df } & \text { SS } & \text { MS } & F & p \text {-value } \\\hline \text { Repression } & 2 & 121783 & 60891.48 & 14.76117 & 0.000286 \\\hline \text { Residual } & 15 & 61876.68 & 4125.112 & & \\\hline \text { Total } & 17 & 183659.6 & & & \\\hline\end{array} These results indicate that ____________.


A) none of the predictor variables are significant at the 5% level
B) each predictor variable is significant at the 5% level
C) x1 is significant at the 5% level
D) x2 is significant at the 5% level
E) the intercept is not significant at 5% level

F) B) and E)
G) A) and E)

Correct Answer

verifed

verified

A multiple regression analysis produced the following output from Excel. A multiple regression analysis produced the following output from Excel.   The correlation coefficient is ____________. A) 0.9787 B) 0.9579 C) 0.9523 D) 67.671 E) 0.0489 The correlation coefficient is ____________.
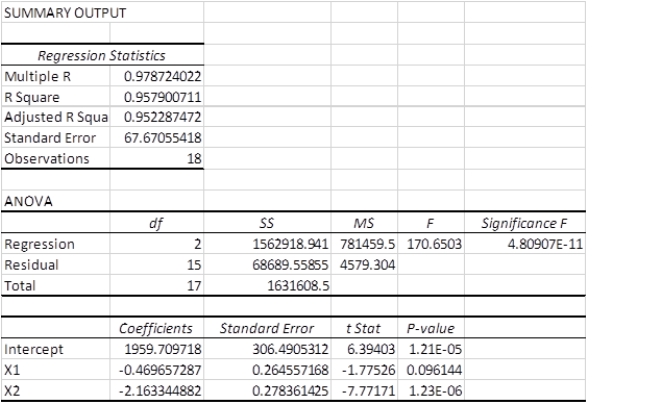

A) 0.9787
B) 0.9579
C) 0.9523
D) 67.671
E) 0.0489

F) B) and D)
G) A) and B)

Correct Answer

verifed

verified

The following ANOVA table is from a multiple regression analysis.  Source dfSSMSFp Repression 31500 Error 26 Total 2300\begin{array} { | c | c | c | c | c | c | } \hline \text { Source } & \mathrm { df } & \mathrm { SS } & \mathrm { MS } & F & p \\\hline \text { Repression } & 3 & 1500 & & & \\\hline \text { Error } & 26 & & & & \\\hline \text { Total } & & 2300 & & & \\\hline\end{array} The observed F value is __________.


A) 16.25
B) 30.77
C) 500
D) 0.049
E) 0.039

F) A) and B)
G) B) and E)

Correct Answer

verifed

verified

Showing 81 - 90 of 90

Related Exams

Show Answer